Do you ever doodle to figure out an idea? Do you sketch out a concept to make sense of it? Have you every created a Post-It Note wall montage on a wall to map out a project? Is there a whiteboard where you have a series of equations or problems you are working through? If so, then visualizing research and related works might be for you!

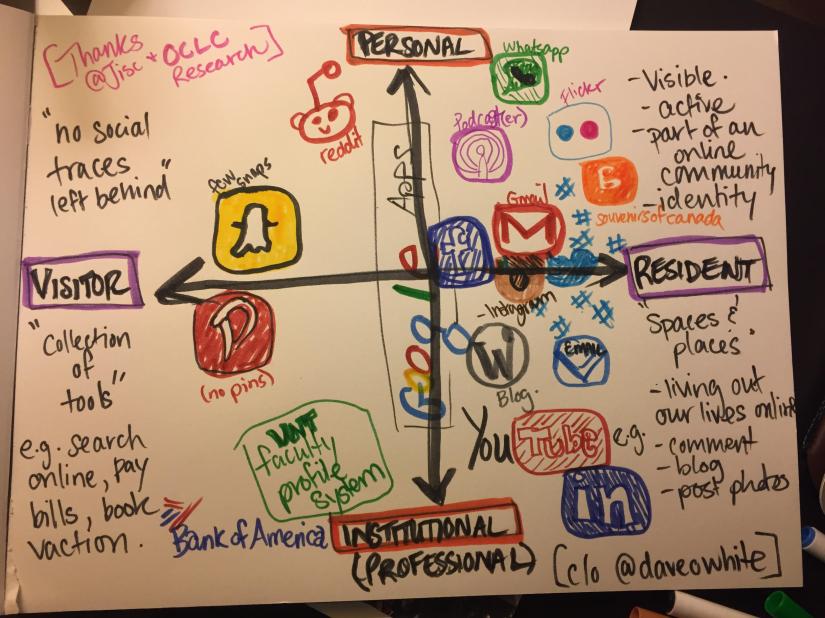
For the last workshop I facilitated, I opted to go low-tech to in order allow for reflection and discussion about our digital spaces and places. Sometimes analog processing with markers provides instigates creativity or creates an opportunity for deeper thinking. Drawing or concept mapping is a process I often use to plan programs/events, design websites, draft course curriculum, and more. I find these visualizations helpful for gathering thoughts, linking concepts ,and facilitating group/team processes.


Much to my surprise, my research role with The Digital Learning and Social Media Research Group has moved beyond your typical scholarly practice, such as literature review, data collection, data analysis, and academic writing, to include a visual design to share research. I thank/blame George for the opportunity to dig into valuable research to identify findings and implications by creating a short script and putting these audio narrations to animated format on the Research Shorts YouTube Channel [If you’re not subscribed, you should!].


In a recent Research Shorts video, we scripted and produced Hilton’s (2016) recent article review of OER and college textbooks choices (highlighted in George’s post). Although this is an open access publication, we hope this video visualization extends beyond the typical scholarly audience and reaches other campus stakeholders in higher education who are thinking about these learning resources. You can view this video here:
For the Research Shorts video creation process, I have been scripting and storyboarding academic articles (of mine and others) to explain the implications and applications of these studies in a few short minutes. This work has made me think more about how I include visuals in my own scholarly practice, specifically to identify the “so what” or key points for my own initiatives. I typically map out works-in-progress, lesson plans, course designs, and meetings I will be facilitating or hosting by using a visual map or plan. From my experiences, visualizations for research and work projects have helped myself and my research collaborators:
- Ideate and brainstorm for developments/project planning
- Filter and itemize relevant results for literature reviews
- Map out concept for a research plan and work initiatives
- Connect the dots between theories and relevant published research
- Organize a research pipeline and project workflows for effective project management
- Provide “in plain English” about your research findings
- Highlight key implications based on research results
- Develop better images or visuals for conference presentations and/or posters
- Showcase information through a new communication method or medium
- Can lead to new insights for yourself and your audience/stakeholders — offer access to publications or complex work designs
- Capture the “what’s the point” for organizational leaders for published reports
- Pitch research implications/findings as an executive summary in meetings
Beyond creating a video to share visual research on YouTube, I am also considering what images or graphs I put into my own academic publications. Our written text can tell the story of our research; however, diagrams, images, or graphs can create meaning to our academic manuscripts, reports, and planning documents. What does the aesthetics of science look for you? Have you put much thought into how you visualize traditional research publications, like conference proceedings or journal articles? What support your academic writing beyond the text? Do you give much consideration to these in your writing? If so, please share.
Reference:
Hilton, J. (2016). Open educational resources and college textbook choices: a review of research on efficacy and perceptions. Educational Technology Research and Development, 1-18.

You must be logged in to post a comment.